11. From A Notebook
Goal: get exactly the arrays the app draws into Python, for statistics or custom figures, without re-implementing window resolution, track matching, haplotype remapping or group aggregation.
genomics.visualizer.client talks to a running app. It needs only the standard library and numpy,
and it waits on the background jobs that the heavier requests start.
from genomics.visualizer.client import Visualizer

v = Visualizer("http://127.0.0.1:8780", dataset="1kg_high_coverage")
start, end = 247_235, 277_052                   # TYRP1 gene body (window offsets)

means = v.group_means("TYRP1", "rna_seq", field="superpopulation", tracks=[1], start=start, end=end, bins=600)
ref = v.reference_signal("TYRP1", "rna_seq", tracks=[1], start=start, end=end, bins=600)
obs = v.observed("TYRP1", "rna_seq", tracks=[1], start=start, end=end, bins=600)

means["edges"]                                  # bin edges (bins + 1,)
means["groups"][0]["group"], means["groups"][0]["mean"]   # 'AFR', array (tracks, bins)
obs["tracks"][0]["provider"], obs["tracks"][0]["mean"]    # 'ENCODE', array (bins,)
A dozen lines of matplotlib on those arrays give this figure:
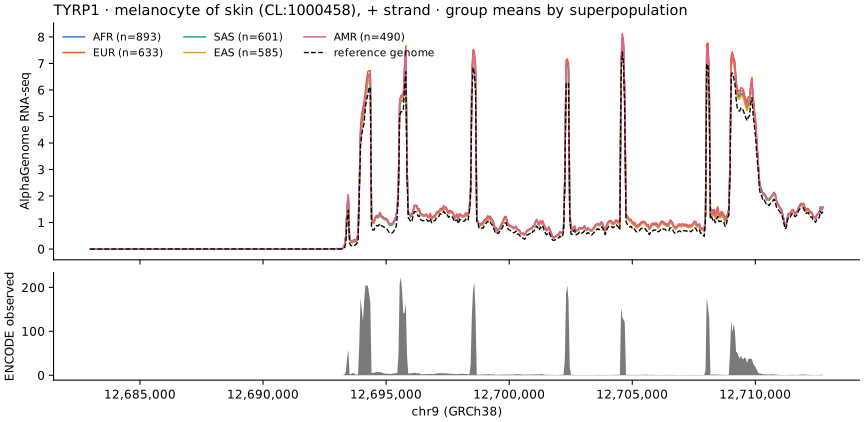
group_means, reference_signal and
observed. These are the numbers behind the Tracks views of
step 3.You don't have to write these calls by hand. On the Tracks page, Export → Copy as Python copies the call for the view on screen, with its gene, tracks, range, binning, haplotypes or groups and cohort filters filled in.
| Method | Returns |
|---|---|
datasets, summary, genes, samples, cohort |
the dataset, its windows and its sample table (with region scalars and PC fields). samples() is a pandas DataFrame when pandas is installed |
signal, reference_signal, observed |
per-haplotype predictions, the reference-window prediction, and the measured ENCODE / FANTOM5 signal |
group_means |
mean ± SD per group of a sample field over the cohort |
variant_sites, variant_effect, genotypes |
cohort sites, the in-silico eQTL at one site, genotype counts |
scalars, pca |
region-scalar definitions and the genotype PCA |
sessions, session |
saved views, to reproduce a figure's exact view |
products, products_fasta, report, expression |
the Gene products page: transcripts and proteins per haplotype, its report, and mRNA/protein against the reference per tissue |
That is the end of the tour. From here:
- the Visualizer reference describes every control, data source and computation;
- From genome to function explains the reasoning behind the pages;
- Pipelines covers the command-line side.